Introduction
This section explains how to open/create charts in Swordfish.
Method
| • | Open an Instrument window by clicking on the Windows menu item and select one of the windows that you have created. |
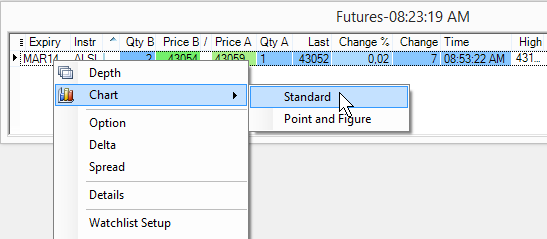
| • | Select the instrument by left-clicking the mouse on the instrument name - the row containing the instrument is surrounded by a dotted line and there is a small black arrow in the left margin, indicating that the instrument is selected. |
| • | Right-click the mouse on the instrument, and select Chart > Standard from the pop-up menu: |
| • | If you are opening a chart for the first time for a particular instrument , the chart window displays. |
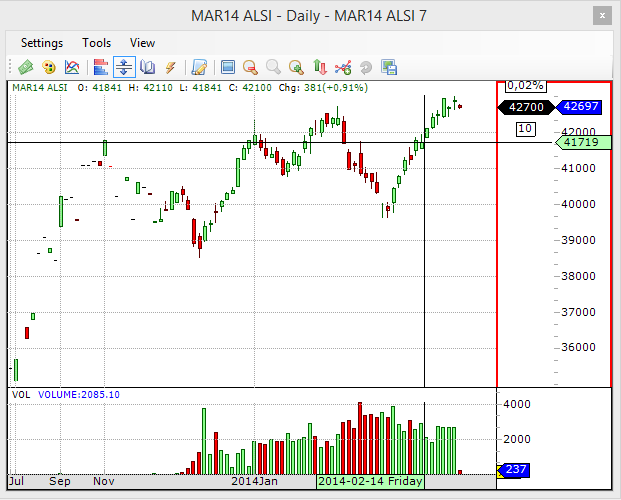
| • | Above image shows a chart with an interval of 5 minute with candle line type for Price (upper part) and a bar chart representing volume(lower part). |
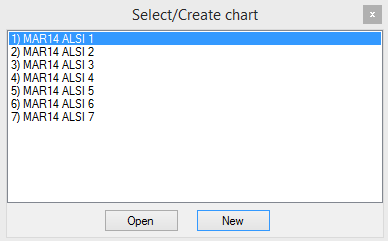
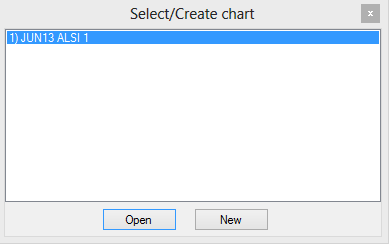
| • | On subsequent Chart requests select from the displayed window (below) a previously opened chart and click on Open or click on New to create a new chart. |
Note
| 1. | The first time a chart is opened, it may take up to 30 seconds to retrieve the data. |
| 2. | Instruments that have not traded will not have charts available and instruments with very light volumes will most likely not have meaningful charts. |
|
Method
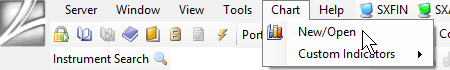
| • | Click the Chart menu item on Swordfish main menu. |
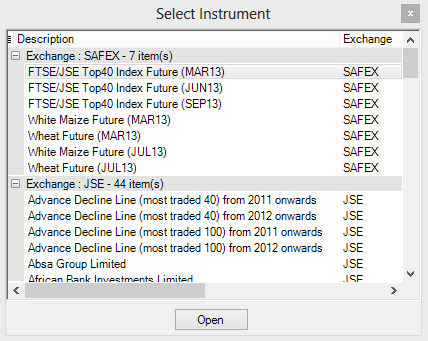
| • | Select an instrument on the Select Instrument window shown below and click the Open button. |
| • | Select from the displayed window (below) a previously opened chart and click on Open or click on New to create a new chart. |
|
Method
| • | Open a watchlist with the desired instruments. |
| • | Click on the desired instrument and drag to an already opened chart. Release on the chart. |
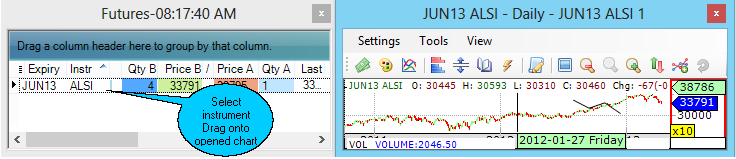
| • | Instrument will open as a chart. |
|
©Estuary Solutions (www.estuarysolutions.com), All rights reserved.


