Chart Areas |
  
|
| Show/Hide Hidden Text |
Chart Areas |
|
| Show/Hide Hidden Text |
Introduction
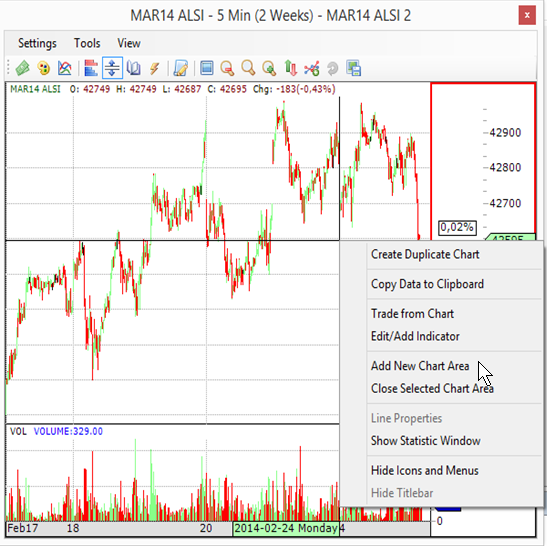
Default areas of a chart shows Price and Volume indicators. Closing existing or adding additional chart areas are done by using the context menu.
Method
•Open a chart. The image below shows the two default chart areas and the context menu as a result of right-clicking on a chart area.
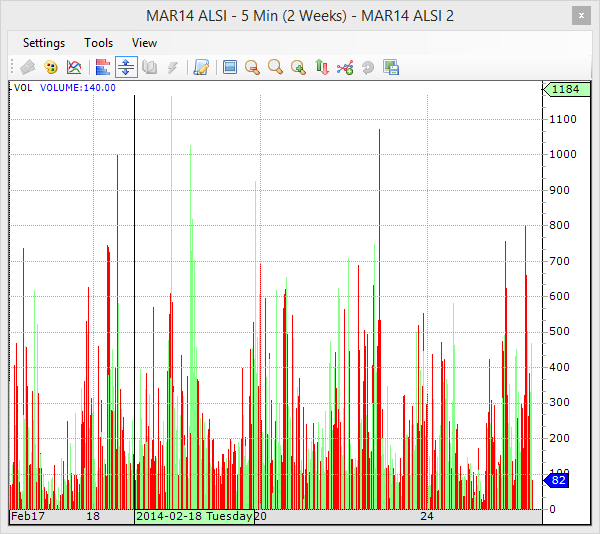
•Click on Close selected chart area and see the effects below.
|
Method
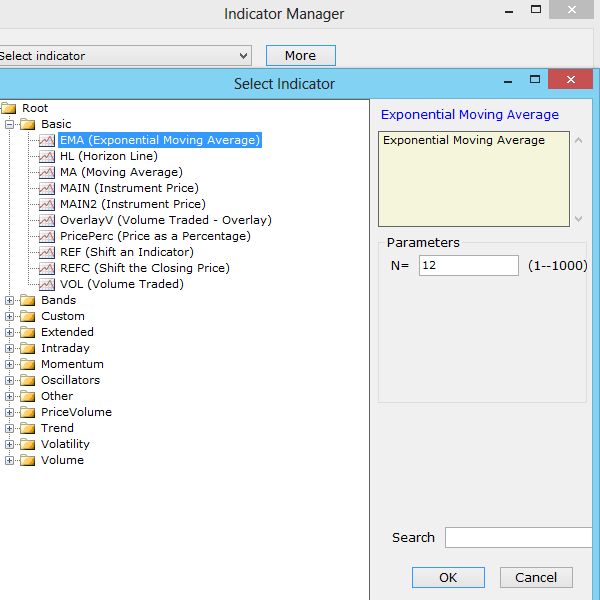
•Additional chart areas are added by using the context menu displayed by right-clicking on the chart area.
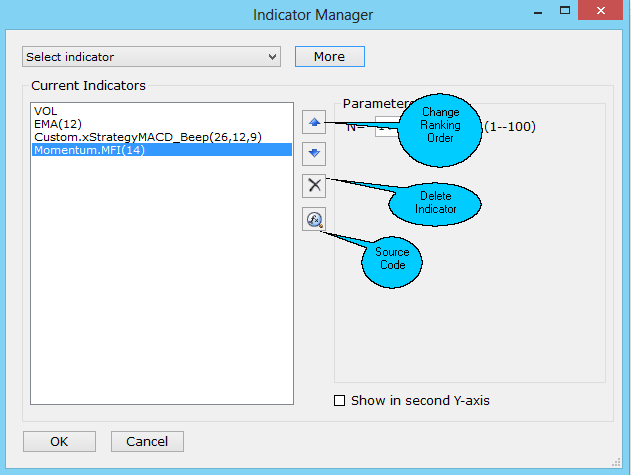
•The Indicator Manager is displayed. Click on Select to add new indicators or click on More button to show a list of indicators.
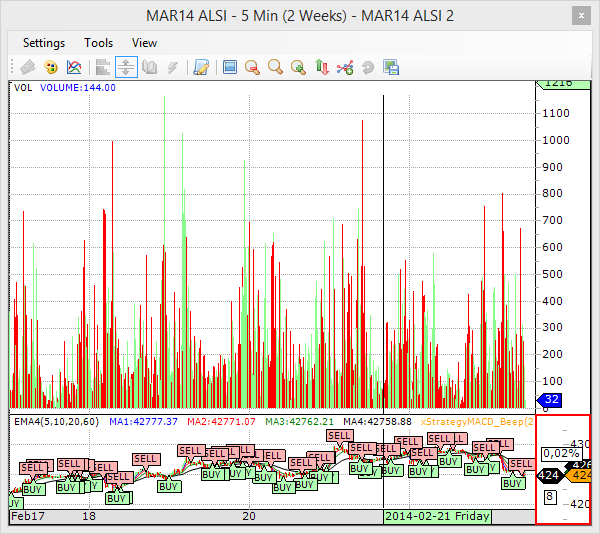
•Select one or more indicators to add and click on OK. Note that multiple indicators selected here will display in the same chart area. The image below shows the added Average True Range indicator.
|
The indicator on the same chart area can be edited to add or remove indicators from the chart area.
Method
•Open a chart. Display the context menu by right-clicking on the chart. Select Edit/Add Indicator or Tools -> Edit/Add Indicator.
•The Indicator Manager is displayed. Click on Select to add new indicator or click on More button to show a list of indicator.
•Select one or more indicators to add and click on OK. Note that multiple indicators selected here will display in the same chart area. Use the
|
©Estuary Solutions (www.estuarysolutions.com), All rights reserved.