Opening a chart |
  
|
| Show/Hide Hidden Text |
Opening a chart |
|
| Show/Hide Hidden Text |
Introduction
This section explains how to open/create charts in Swordfish.
Method
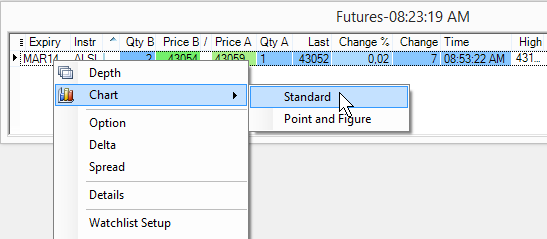
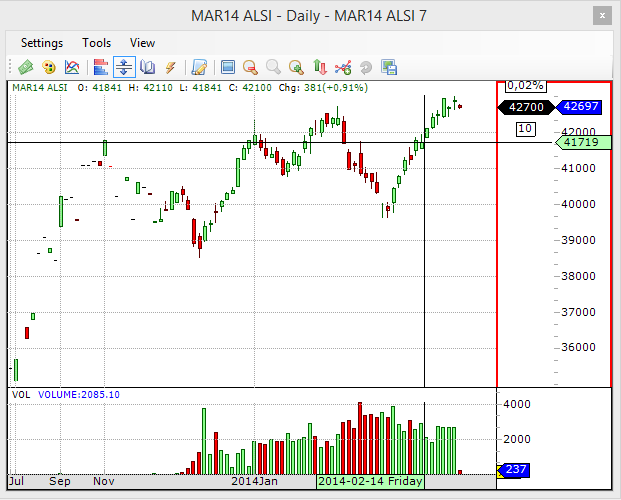
•Open an Instrument window by clicking on the Windows menu item and select one of the windows that you have created. •Select the instrument by left-clicking the mouse on the instrument name - the row containing the instrument is surrounded by a dotted line and there is a small black arrow in the left margin, indicating that the instrument is selected. •Right-click the mouse on the instrument, and select Chart > Standard from the pop-up menu: •If you are opening a chart for the first time for a particular instrument , the chart window displays. •Above image shows a chart with an interval of 5 minute with candle line type for Price (upper part) and a bar chart representing volume(lower part).
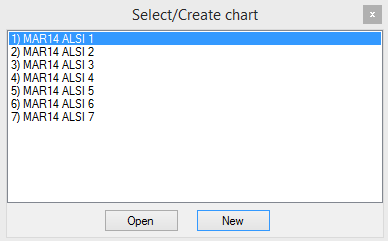
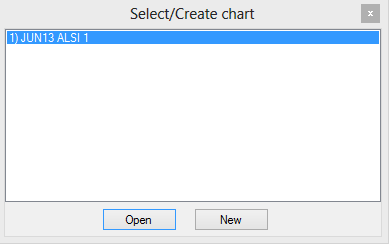
•On subsequent Chart requests select from the displayed window (below) a previously opened chart and click on Open or click on New to create a new chart.
Note
1.The first time a chart is opened, it may take up to 30 seconds to retrieve the data. 2.Instruments that have not traded will not have charts available and instruments with very light volumes will most likely not have meaningful charts.
|
Method
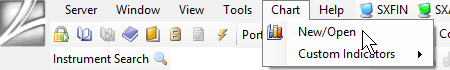
•Click the Chart menu item on Swordfish main menu.
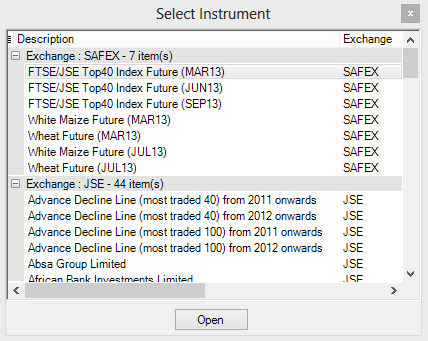
•Select an instrument on the Select Instrument window shown below and click the Open button.
•Select from the displayed window (below) a previously opened chart and click on Open or click on New to create a new chart.
|
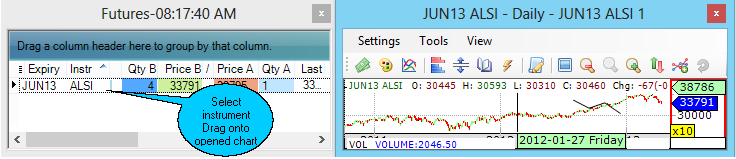
Method •Open a watchlist with the desired instruments. •Click on the desired instrument and drag to an already opened chart. Release on the chart.
•Instrument will open as a chart. |
©Estuary Solutions (www.estuarysolutions.com), All rights reserved.