Introduction
Zooming is useful when you want to enlarge a particular area of a chart.Watch the video Chart Zooming.
Method
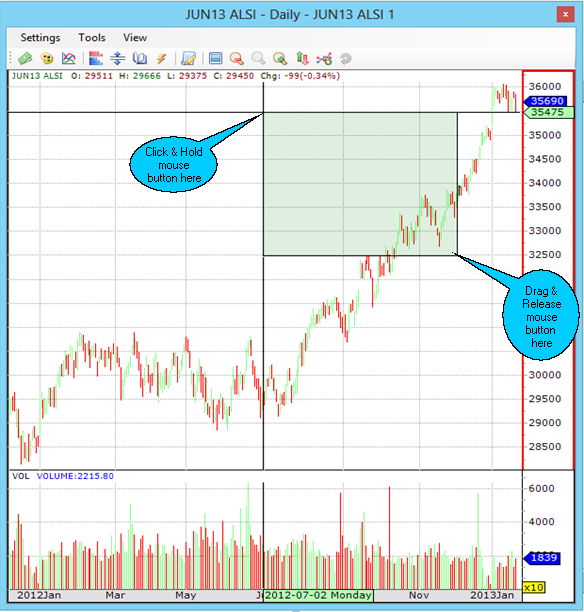
Open a chart. Left-click the mouse in a position that will represent the upper left corner of the enlarged area. Keep the mouse button pressed and drag the mouse to a point that will represent the lower right-hand corner of the enlarged area. Release the mouse button.

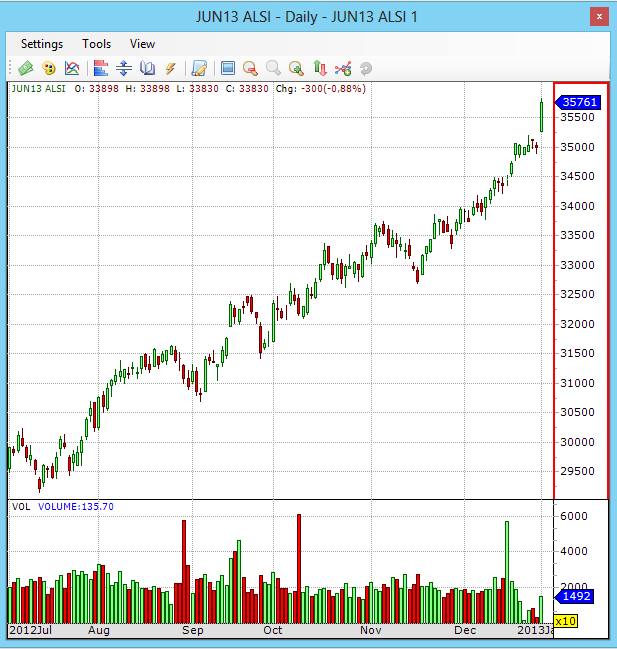
The next window shows the selected area as enlarged.

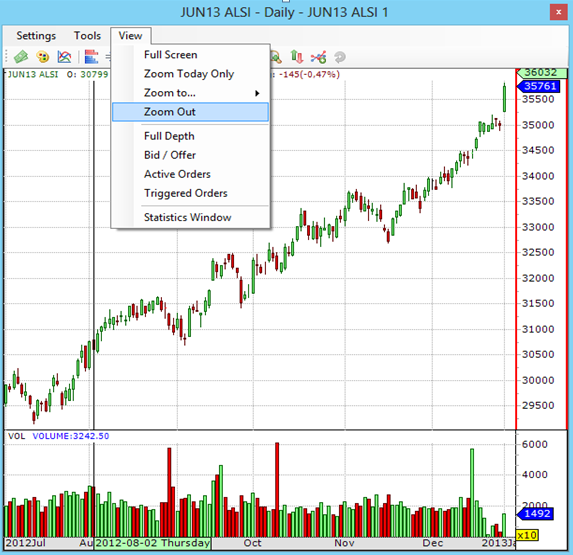
Undo the zoom effect by clicking chart menu View > Zoom Out.

©Estuary Solutions (www.estuarysolutions.com), All rights reserved.