Introduction
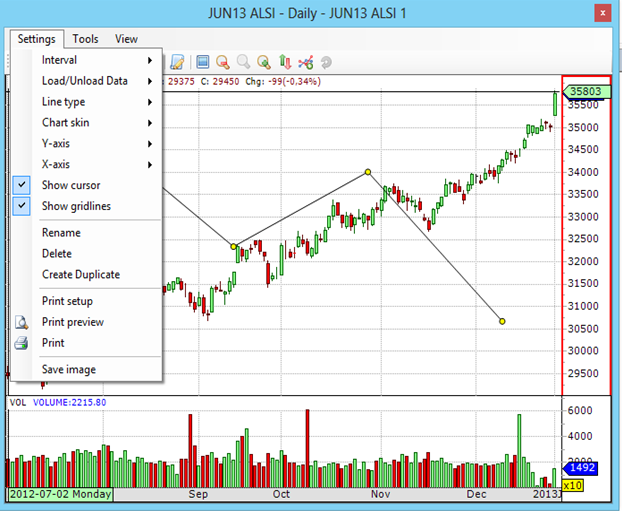
Chart settings allows the chart to be customized in terms of period interval eg tick, 1 minute, 1 day etc. Select from candle, line ,HLC bars and OHLC bars for the line type. A chart skin can be applied, X-and-Y axis hidden or shown, cursor and grid lines can be hidden or shown. Printing of the chart and saving the chart as an image is done from this menu.
Method
•Open a chart. Click on the Settings menu item at the top left of the chart. The ticked items on the list shows the settings that are applied to the chart.

Note
1.Showing / hiding chart information allows you to customize your chart view and to maximize the available space.
©Estuary Solutions (www.estuarysolutions.com), All rights reserved.